
Trade Map is the International Trade Centre's (ITC) free tool for trade statistics by country and product. For an exporter its best use is market selection: it shows which countries buy your product, how much, from whom, and your country's share of each market. Below we go through it step by step with olive oil (HS 1509). The screens were captured on 28 September 2026 in the new Trade Map interface, with 2025 data. At the end we turn the numbers into a five-country shortlist and read it.
The worked example uses Türkiye as the exporting country, because that is where the screens were captured. Every step works the same way if you export from India, Vietnam, Kenya, Brazil or anywhere else: choose your own country where we choose Türkiye.
In this guide
- Find your HS code
- Who buys your product?
- Where does your country already sell?
- Who supplies the target market?
- Turn the numbers into a shortlist
- The company list
- Mirror data: when the numbers are not the country's own
- Common mistakes
- Other ITC tools: tariffs and export potential
Before you start
- Registration is free. Create an account with your email at trademap.org. ITC says Trade Map covers more than 230 economies and more than 5,300 products.
- The interface is new. ITC relaunched the tool in spring 2026 as Trade Map 3.0 (announcement). The tab names stayed the same: Time series, Trade indicators, Companies. Videos recorded on the old screens will show different menus; the old version remained available at legacy.trademap.org.
0. Find your HS code
Everything in Trade Map starts with a product code. Customs codes are built in layers:
- The first 2 digits are the chapter (15 is fats and oils).
- The first 4 digits are the heading (1509 is olive oil).
- The first 6 digits are the Harmonized System (HS) subheading, and they are the same in every country that uses the HS (150920 is one olive oil subheading).
- Digits after the sixth are national. The EU and India use 8-digit codes, the United States 10. They differ from country to country.
If you do not know your code, look it up in your own country's customs tariff, check an earlier shipping bill or invoice, or ask your freight forwarder or customs broker. For comparing countries Trade Map works with 2, 4 and 6-digit codes, because digits beyond the sixth are not comparable across countries. Four digits give a broad picture; six are more precise, but some countries report less data at that level.
1. Who buys your product?
On the "Trade indicators" tab, set "Trade flow" to Imports, importer and exporter to World, and the product to your HS code. The table ranks the importing countries from largest to smallest.
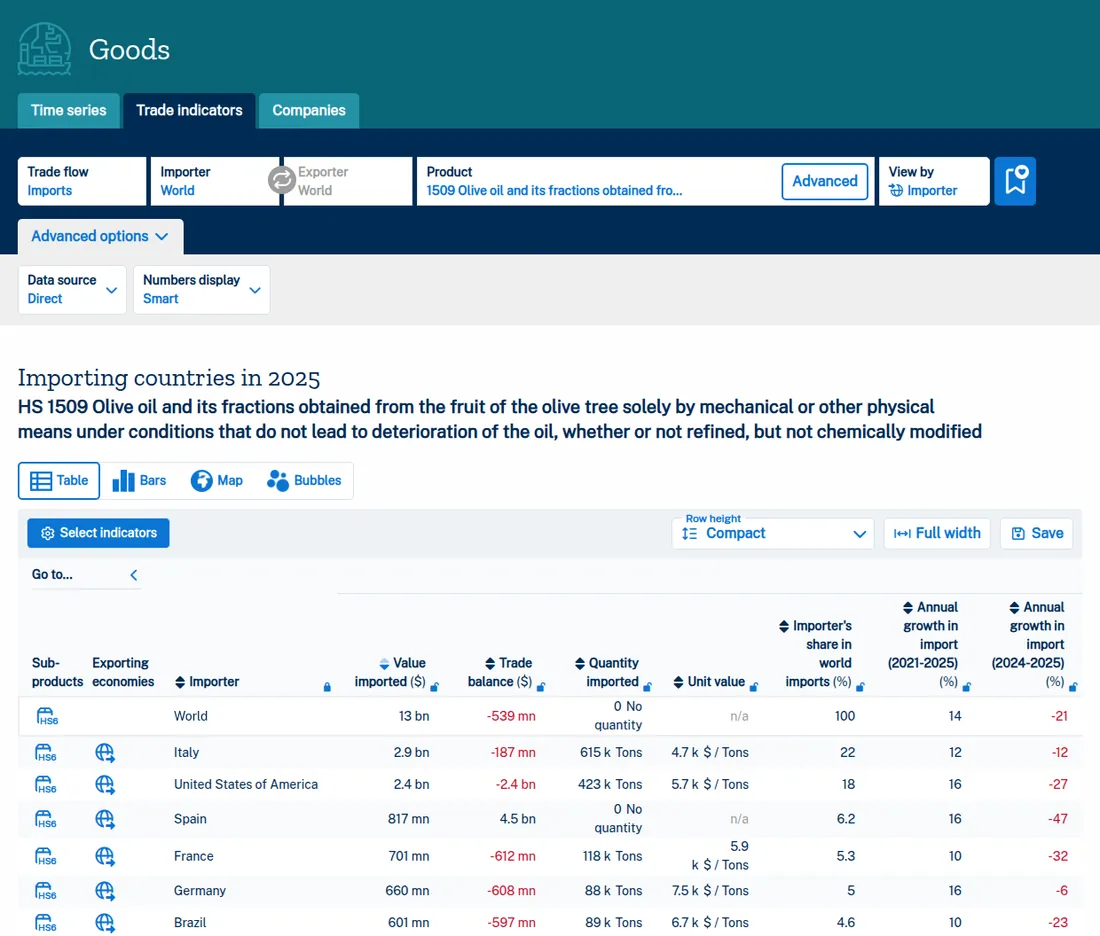
Which columns to read:
- Value imported: the size of the market.
- Annual growth (2021-2025) and (2024-2025): is the market growing? World olive oil imports fell 21% in the last year, yet grew 14% a year on average over 2021-2025. Read the five-year trend, not one year.
- Unit value: the average price per tonne. It shows the price level the market works at. Where a country does not report quantities the column stays empty; in this table Spain shows "No quantity".
- Trade balance: exports minus imports. Easy to skip, and it says a lot. Spain imports 817 million dollars of olive oil, but its trade balance is +4.5 billion: it is a major producer and exporter. Italy imports 2.9 billion and its balance is only -187 million, so it sells on much of what it buys. These are markets for bulk buyers and bottlers more than for finished consumer products. A large negative balance, as in the United States (-2.4 billion) or Germany (-608 million), points to a market that consumes what it imports.
The Select indicators button above the table adds or removes columns. Table / Bars / Map / Bubbles show the same data as a chart or a map. The HS6 icon at the start of each row splits that country's purchases into 6-digit subheadings (so extra virgin and other olive oils appear separately), and the globe icon next to it opens that country's list of supplying countries.
2. Where does your country already sell?
Set "Trade flow" to Exports, the exporter to your country and "View by" to importer. In our example the exporter is Türkiye.
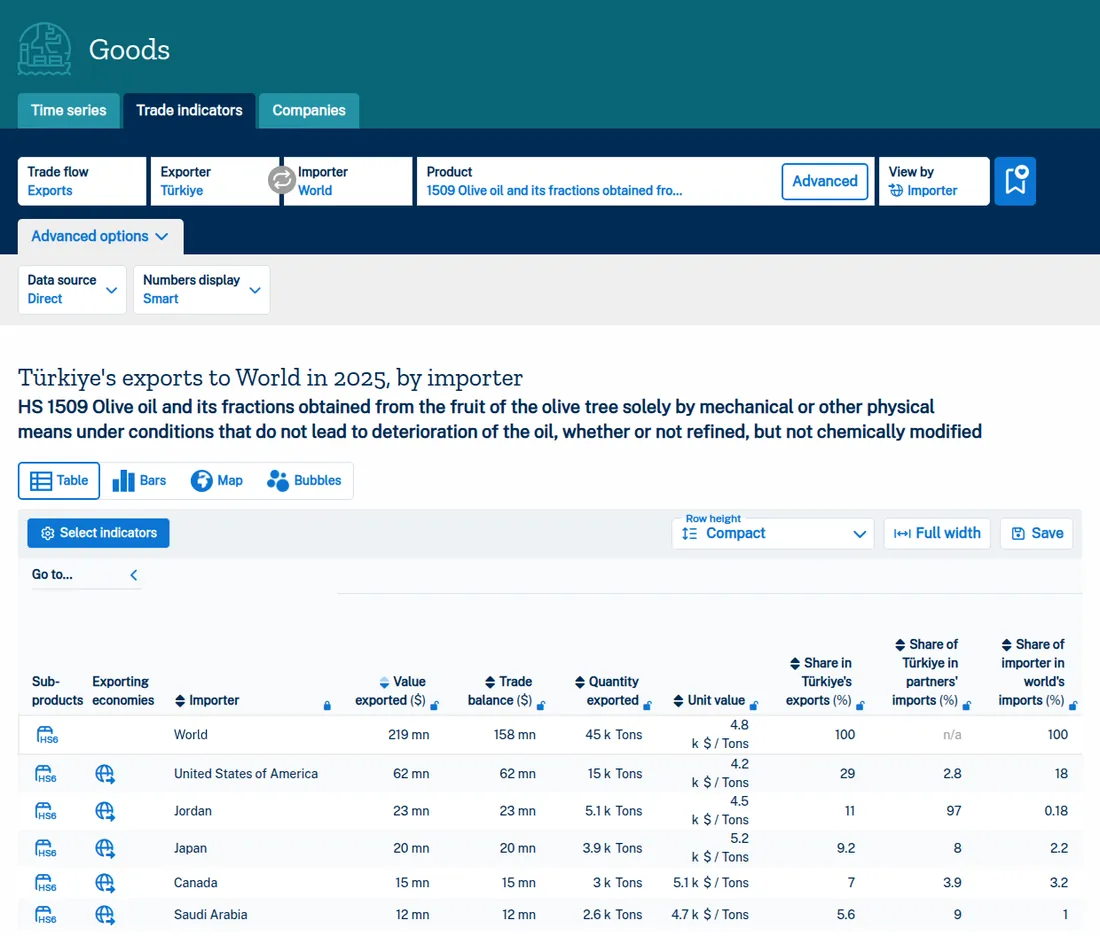
The most useful column here is "Share of [your country] in partners' imports": your country's share of each partner's total purchases. In Jordan Türkiye's share is 97%: that market is already supplied by Turkish exporters. In the United States it is 2.8%: a large market with a small share.
The last column, "Share of importer in world's imports", is that country's weight in the world market. Read the two together. The United States takes 18% of world imports and Türkiye holds 2.8% of it. Jordan is 0.18% of the world and Türkiye already holds 97%. The room to grow is in the United States, not in Jordan.
Unit value here is the average price your country gets in each market. Türkiye sells at 4.8 thousand dollars a tonne on average: 4.2 thousand to the United States, 5.2 thousand to Japan, 5.1 thousand to Canada. The same product goes to different markets at different price and quality levels.
3. Who supplies the target market?
Pick a candidate country, for example Germany. Set "Trade flow" to Imports, importer to Germany, exporter to World and "View by" to exporter.
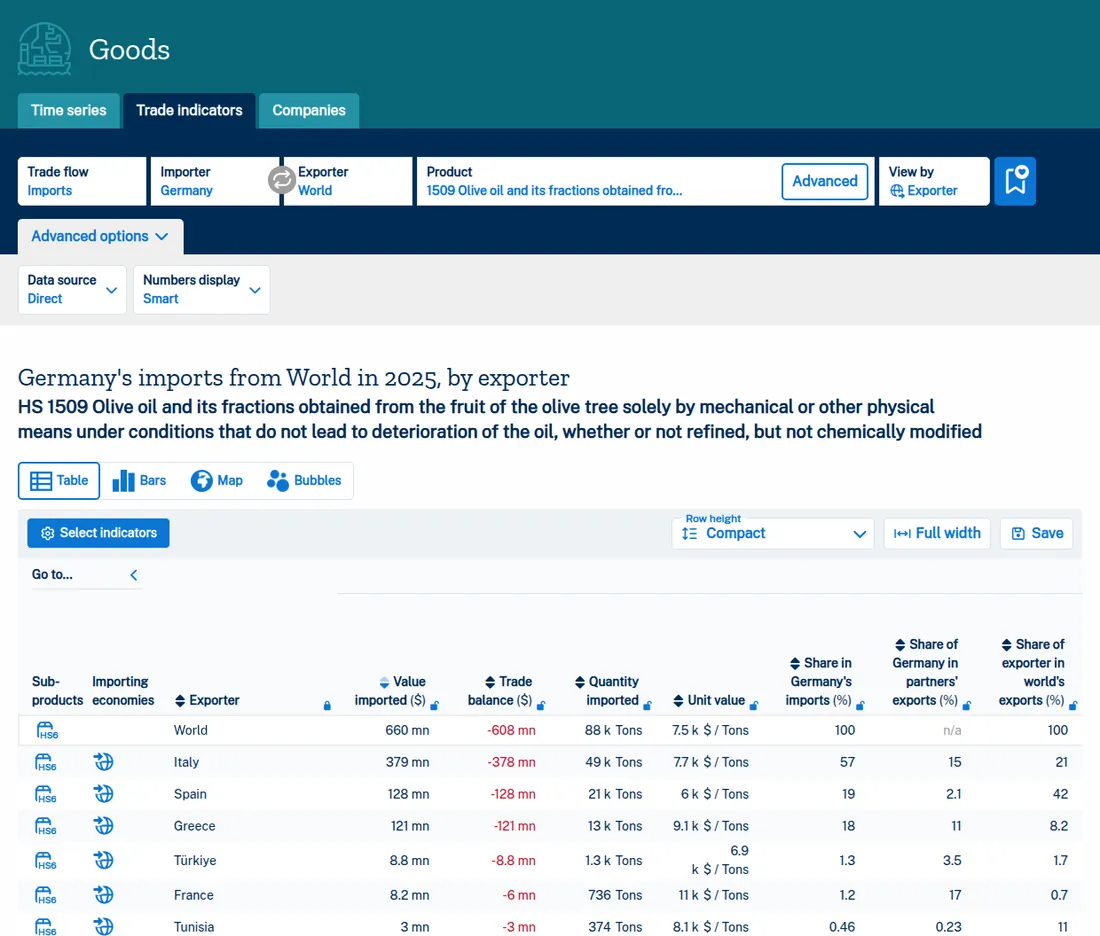
This table answers two questions. Who are your competitors: in Germany, Italy, Spain and Greece. Where does your price sit: olive oil from Türkiye averages 6,900 dollars a tonne, Spain's 6,000, Italy's 7,700 and Greece's 9,100. A large gap in unit value can also point to a different grade or pack format, so compare like with like.
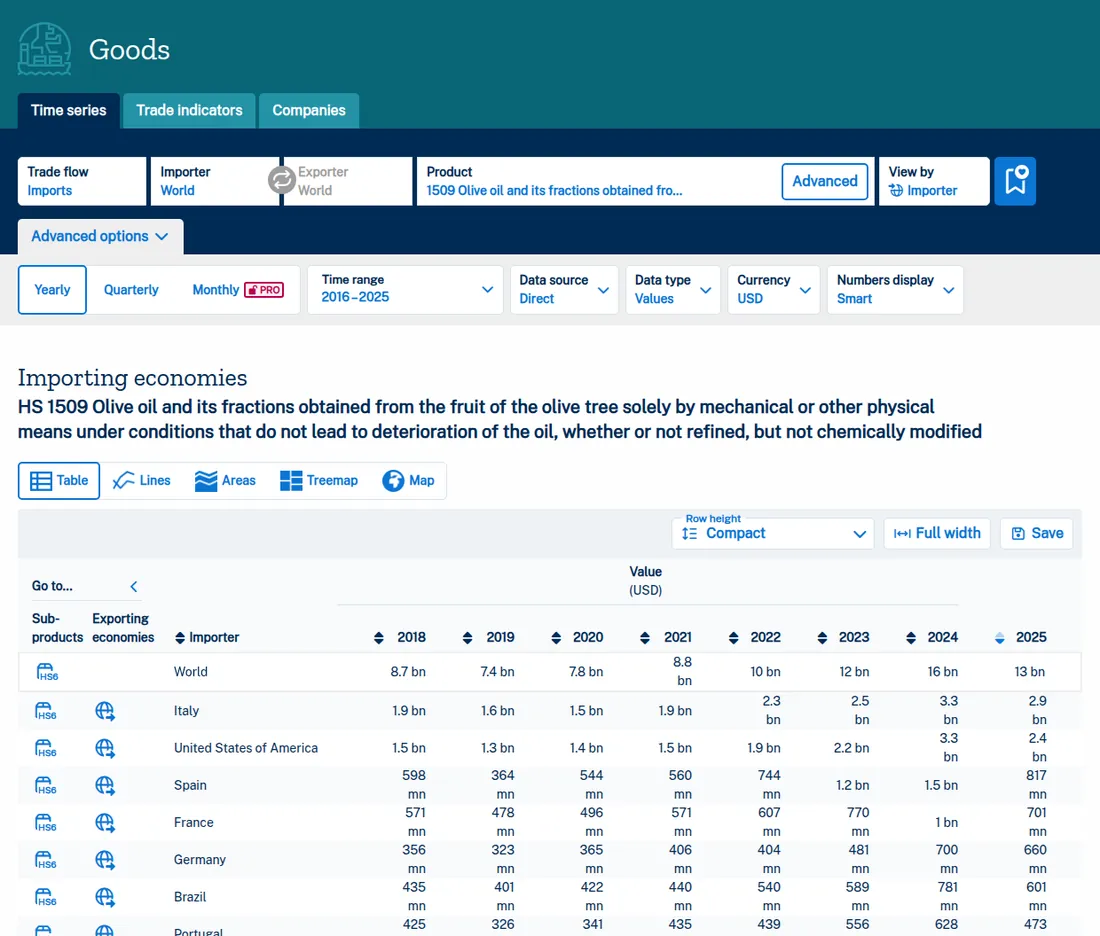
The "Time series" tab shows the same market over the years. Germany's olive oil imports were 356 million dollars in 2018 and 660 million in 2025. You can switch between yearly and quarterly data, change the time range, and view the series as a table, lines, areas, a treemap or a map.
4. Turn the numbers into a shortlist
Instead of reading the tables one by one, put the candidate countries side by side on the same measures. The table below is built from the 2025 figures in the screens above. Market size for Canada, Japan and Jordan is calculated from their share of world imports, so it is approximate.
| Country | Market (imports) | Türkiye's share | Sales from Türkiye | Note |
|---|---|---|---|---|
| United States | $2.4 billion | 2.8% | $62 million | Largest market; Türkiye's largest buyer, but a small share |
| Germany | $660 million | 1.3% | $8.8 million | Italy, Spain and Greece dominate; high average price |
| Canada | ~$420 million | 3.9% | $15 million | Mid-sized; Türkiye sells at $5,100 a tonne |
| Japan | ~$290 million | 8% | $20 million | Established for Türkiye, with a high price |
| Jordan | ~$23 million | 97% | $23 million | Already supplied by Turkish exporters |
What to look for when you read it:
- Large market, small share: the United States and Germany. Demand is there and your country is still small. That is the opportunity, but competition is strong; find out why the share is small (price, certification, brand, logistics) before you commit.
- Small market, large share: Jordan. Hard for a new supplier from the same country: buyers already buy from your compatriots, so you have to replace someone.
- Mid-sized market, meaningful share: Japan and Canada. Your country is known there and the price is good, which makes references easier.
- Trend: do not read one year. World olive oil imports fell 21% in 2025 but grew 14% a year on average over five years; in the United States and Germany five-year growth is 16% a year.
The table is a first filter. For the two or three countries that stay on the list, check tariffs, documents and how distribution works before you decide (see ITC's other tools below).
5. The company list: useful, but limited
The "Companies" tab lists companies importing the product in the country you choose. For olive oil (1509) in Germany it returns 25 companies, with name, city and website.
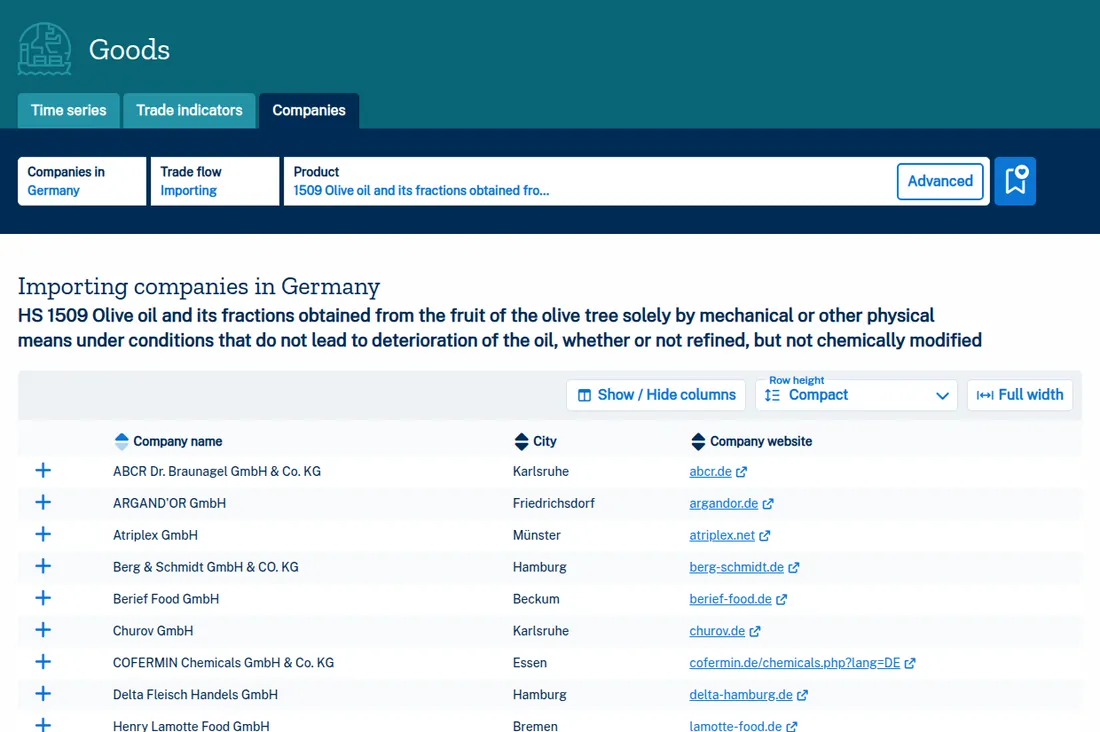
Three things to keep in mind:
- The list is short. 25 companies are a small part of a 660 million dollar market.
- Not all are buyers. The list includes entries that are, by their names, a meat trader and a chemicals company. You cannot tell from the list which will buy your product.
- No people. Trade Map does not tell you who to write to at the company, or what to write.
Mirror data: when the numbers are not the country's own
Not every country reports its trade statistics. For those that do not, Trade Map reconstructs their trade from what their partner countries report. This is called mirror data. ITC describes mirror statistics as a second-best solution: better than having no data, but not a substitute for the country's own figures. They also miss trade between two countries that both do not report.
Three practical points, from the Trade Map FAQ:
- Check the "Data source" setting. It shows whether you are looking at direct or mirror data. Never add direct and mirror figures for the same country together.
- Exports and imports are valued differently. By international standard exports are valued FOB (without freight and insurance) and imports CIF (with them), though some countries do not follow this. So a mirror figure built from partners' exports will not match the importing country's own import figure.
- The two sides rarely match anyway. Timing, free zones, re-exports and transit all cause gaps between one country's exports and its partner's imports. Read the figures as an order of magnitude, not to the last dollar.
Common mistakes
- Reading only the last year. For products whose prices swing, like olive oil, one year misleads. Read the five-year growth column and the Time series tab together.
- Taking value for volume. When prices rise, import value grows even if fewer tonnes are bought. Turn on the Quantity and Unit value columns too.
- Using mirror data without knowing it. See the section above. Check "Data source" whenever a market looks surprising.
- Treating a producer as a consumer market. If the trade balance is positive or close to zero, the country may be processing and re-exporting the product. Spain and Italy above are the example.
- Narrowing the code too far. At 6 digits some countries' data and the company list go empty. Start with 4 digits, then drill down with the HS6 icon.
- Skipping tariffs. If a large market charges your country a higher tariff than your competitors pay, that may explain your small share. Check it in Market Access Map.
Next to Trade Map: ITC's other tools
- Market Access Map: the tariff the target country applies to your product, the preferential rates your country can use under trade agreements, and non-tariff measures.
- Export Potential Map: ITC's estimate of which products a country could sell more of, and in which markets. A good second opinion for adding candidates to your shortlist.
What Trade Map does not tell you
Trade Map gives you data for choosing a market; it does not make the choice for you. It shows how much a country buys, but weighing what makes entry easier or harder is up to you: tariffs, documents and compliance, the supplier structure in the market, payment and collection risk.
Outfound's market research brings these together in one report. It compares candidate countries for your product and, for each one, sets out tariffs, the supplier structure, rules and documents to verify, export support and payment collection, with sources, and proposes a 12-month entry plan.
Once you have chosen the country, the next job is to find the companies there that sell, process or use your product today and reach the decision-maker. Outfound does that too: it searches the target country for the buyer you describe, reads each company's website today, lists the ones that fit with the reason, and writes the first email in the buyer's language.
Other sources are in how to find buyers for export and, for Indian exporters, how to find buyers for export from India. How Trade Map compares with customs data is in customs data vs buyer research. For market selection end to end, see choosing your first export market. Country guides: USA, Germany, UAE, UK, Canada, Australia.
Last updated: · By: Tolga Tatar